





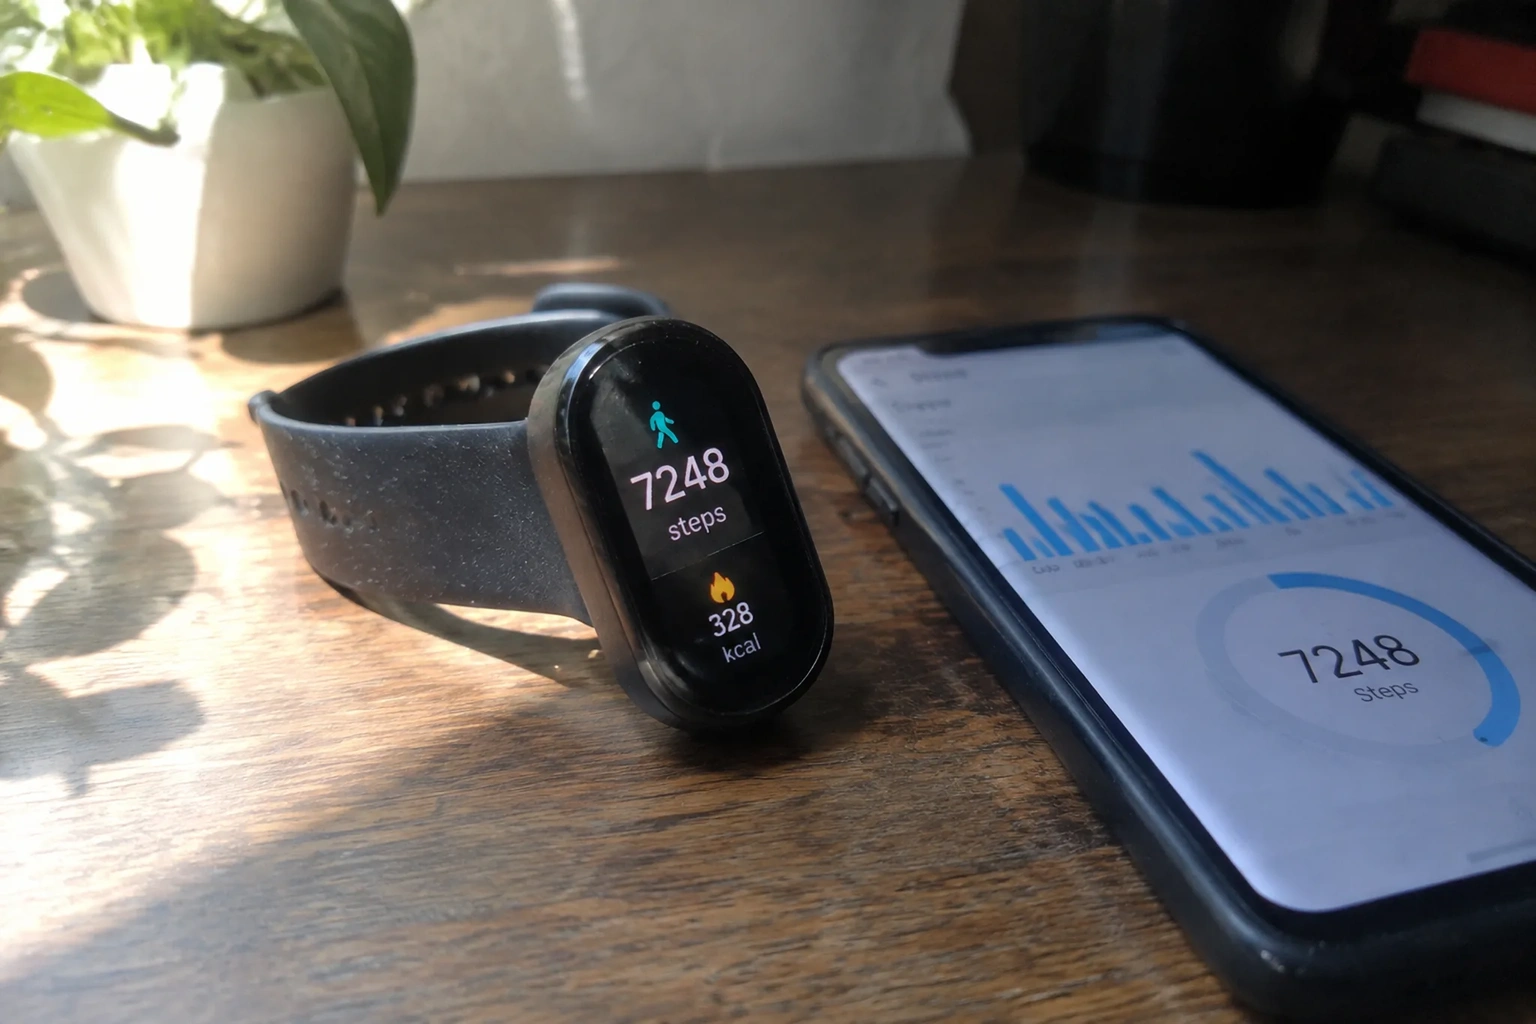
Most fitness trackers spend their first month being fascinating and their next eleven being ignored. The wristband keeps logging, the app keeps syncing, and somewhere around week six the whole apparatus becomes a very expensive way to count steps that nobody reads. The data was never the problem. The problem is that raw output from a wrist device is close to useless until someone decides what question it is supposed to answer.
A step count is the least interesting number these devices produce. It is also the number displayed largest on the home screen, which tells you something about how these products are marketed versus how they are actually used. Steps are a proxy for movement, and movement is good, but a person who walks 9,000 steps through a shopping mall and a person who walks 9,000 steps on a hilly trail have logged the same number and had very different afternoons. The device knows this. It just does not lead with it.
What the optical sensor on the wrist can actually measure
The green light on the back of a fitness tracker is a photoplethysmography sensor, which is a fancy way of saying it shines light into the skin and watches how the blood underneath changes the reflection. From that signal the device derives heart rate, and from heart rate over time it estimates a handful of other things: resting heart rate, heart rate variability, sleep stages, stress load, and something usually labeled "recovery."
Each of those estimates carries a different amount of trust. Resting heart rate, measured overnight, is reasonably solid. Sleep staging is rougher than the marketing implies; consumer wearables tend to agree with lab polysomnography on total sleep time and disagree more on which stage a person was in at 3 a.m. Heart rate variability is real data but almost meaningless without a consistent measurement window. A number that swings because the wearer checked it at different times of day is not a metric, it is noise with a chart attached.
Understanding this hierarchy matters more than any single reading. The device is a rough instrument. Treating it like a lab instrument produces either false confidence or unnecessary worry, and both are worse than ignoring it.
The baseline problem: seven days of nothing is worth more than one day of everything
Every useful number on a fitness tracker is a comparison. A resting heart rate of 58 beats per minute means almost nothing in isolation. It means a great deal next to the same person's average from three weeks ago. The device cannot make that comparison until it has weeks of data, and the wearer cannot interpret the comparison until they know what their own normal looks like.
This is why the first month of ownership is best treated as a calibration period rather than a performance period. Wear the thing consistently, including during sleep, and resist the urge to draw conclusions. A person who starts a new training block in week one and then wonders why their "recovery score" is erratic has confused cause and effect: the baseline is being established while the workload changes, so the device is chasing a moving target.
Wear it on the same wrist. Tighten it for exercise and loosen it for sleep, but keep the placement consistent. A tracker that migrates around the body produces a dataset that looks complete and is quietly incomparable to itself.
Resting heart rate is the one number worth checking weekly
If a person only looks at one metric from a wrist device, resting heart rate is the strongest candidate. It is measured during sleep, when movement artifact is low, and it responds to real physiological shifts: fitness gains tend to push it down over months, while illness, alcohol, sleep debt, and heavy training loads tend to push it up within days.
The useful habit is a weekly glance, not a daily obsession. Pull up the seven-day average, compare it to the previous three or four weeks, and note whether it is drifting. A resting heart rate that has climbed five or six beats above a stable personal baseline for several consecutive days is a decent signal to take an easy day, hydrate, and go to bed earlier. It is not a diagnosis. It is a nudge, and it is a surprisingly reliable one.
What makes this work is the personal baseline. Population averages are irrelevant here. A fit 30-year-old and a fit 60-year-old can sit twenty beats apart and both be perfectly healthy. The only comparison that carries information is the wearer against their own history.
Heart rate zones are where most people misread the data
Zone charts are the most screenshot-friendly feature on any fitness app and the most commonly misused. The default zones are usually derived from a formula based on age, which is a population estimate applied to an individual. For a large share of people that formula is off by enough to shift every zone boundary, which means a workout logged as "zone 2" might actually be zone 3, or the reverse.
The fix is not complicated, though it does take effort: replace the age-based estimate with an observed maximum heart rate, ideally from a hard effort or a supervised test, and then set zones as percentages of that number. The device will happily accept the manual entry. Most owners never make it.
Even with accurate zones, the time-in-zone chart rewards a specific kind of workout and quietly punishes another. A long, easy session might show forty minutes in zone 2 and look unimpressive next to a twenty-minute interval block that lights up zones 4 and 5. The easy session built the aerobic base. The chart does not care about that, and neither does the person scrolling past it.
Sleep tracking: read the trend, ignore the stage breakdown
Sleep is where fitness trackers generate the most data and the most anxiety. The nightly report offers a score, a duration, a breakdown into light, deep, and REM stages, and often a "sleep quality" verdict delivered with unearned confidence. The stage breakdown is the weakest part of the whole package. Wrist movement and heart rate can distinguish sleep from wakefulness reasonably well and stages much less well.
Total time asleep and the consistency of sleep and wake times are the numbers that hold up. A person who goes to bed and wakes up within the same hour window most days has a sleep schedule the device can actually describe. Track that over a month and the pattern is real. Track the deep-sleep minutes over a month and the pattern is mostly sensor noise dressed as insight.
There is a second-order problem here worth naming. A device that scores sleep can create a feedback loop: a poor score produces worry, worry produces worse sleep, and the next score is worse still. The instrument starts shaping the thing it measures. The way out is to look at weekly averages and stop opening the nightly report before bed.
Step goals are a floor, and the floor is lower than the default
Ten thousand steps is a marketing number with a round shape, not a physiological threshold. The research on step counts and mortality has generally found that the health benefit curve flattens well before that figure for most adults, and that the biggest gains come from moving people who are currently doing very little up to a moderate amount. The device's default goal is fine as a floor. It is a poor target for someone already walking eight thousand steps a day who could spend that effort on something more demanding.
A more useful framing: use steps to establish a minimum, and use the device's active-minutes or workout logging to pursue intensity. Someone who hits a 6,000-step floor every day and adds two hard sessions a week is in better shape than someone grinding out 12,000 flat, distracted steps and calling it training.
Export the data before the app decides what it means
Fitness apps are built to summarize. They collapse a month of heart rate into a trend arrow and a week of sleep into a colored bar. That summarization is convenient and it is also lossy, and the loss is usually in the direction of whatever the app's designers decided was worth showing.
The raw data is more interesting and more durable. Most platforms allow a full export, usually as a CSV or through a connected service, and that export can be dropped into a spreadsheet where questions the app never asked can be answered. How did resting heart rate respond in the two weeks after a vacation? Did sleep duration change when the commute changed? Did workout frequency drop off in the same month as a particular project at work?
That kind of cross-referencing is where a fitness tracker earns its price. The device is a sensor. The spreadsheet is the analysis. The app is mostly a storefront for the sensor, and treating it as the whole product is how a useful instrument ends up in a drawer.