





A paper chart for menstrual cycles is one of the few tracking tools that asks nothing of its user beyond a pencil and a willingness to look at the same page every day. No account creation, no battery, no company deciding one morning to move the data behind a subscription. A small notebook or a printed grid on the inside of a cabinet door holds the whole record, and it holds it for decades.
The methods below are not a ranking. They are a set of options, ranging from a single line on a wall calendar to a full page of symbols, and the right one depends on how much a person actually wants to see and how much time they will reliably give it.
The humble wall calendar and its one honest mark
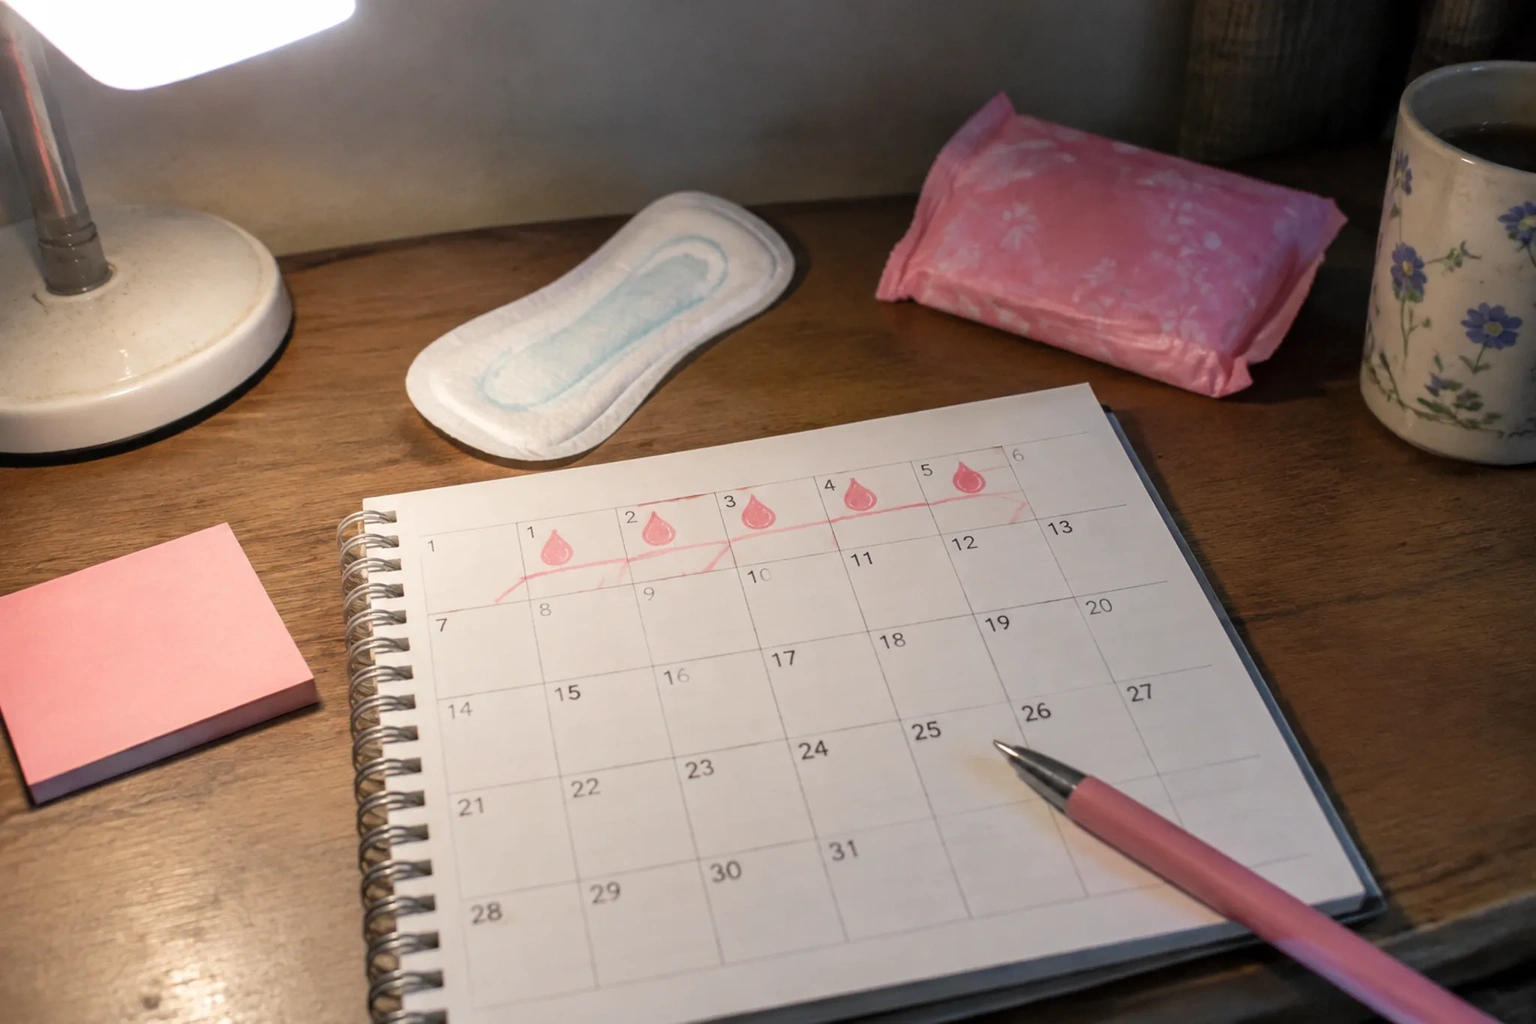
The cheapest system is a wall calendar that already exists in the kitchen. Each day of bleeding gets a small dot in the corner of its square. That is the entire method.
What it captures: the first day of each period, the last day, and the total number of bleeding days. Over three or four months, the spacing between the first dots becomes visible without any arithmetic. A rhythm emerges from the page itself, the way a row of fence posts shows the curve of a hill.
What it misses: everything that is not blood. Ovulation, mood, pain, discharge, sleep. The calendar dot is a blunt instrument, and for plenty of people that bluntness is the point. A single mark takes two seconds and never gets skipped because it is too complicated to bother with.
The one rule that matters with this method: use the same calendar for the whole year, and keep last year's somewhere findable. Comparing this March to last March is where the useful pattern lives.
A dedicated notebook page ruled into columns
A pocket notebook works better than a calendar for anyone who wants more than bleeding dates. The page gets ruled into a handful of narrow columns, one per thing worth recording, and each row is a single day.
A workable set of columns, kept deliberately small: date, bleeding (a number from 1 to 3 for light, medium, heavy), cervical mucus (a one-word descriptor), mood (a single word), pain (a number from 0 to 3), and a short notes column for anything unusual. Six or seven columns fit across a page in a small notebook without crowding.
The temptation with a notebook is to add columns until the page looks like a lab sheet. Resist it. Every added column is a small daily decision, and daily decisions are where paper systems die. Five columns filled honestly for a year beat twelve columns abandoned in February.
Ruling the columns once and photocopying the blank page a dozen times removes the last friction. A stack of pre-ruled pages sits in the notebook, ready, and the only task left is filling in one row before bed.
The four-symbol code that fits in a margin
Symbols beat words when speed matters. A small legend at the top of the page, four or five marks at most, turns a day's entry into a single glance and a single pen stroke.
A common and effective set: a filled circle for a bleeding day, an open circle for a day with noticeable mucus, an X for a day with cramps or pain worth noting, and a dot for an ordinary day with nothing to report. A slash through any symbol marks a day with sex. That is five marks, and they cover the bulk of what most people actually want to remember.
The legend is the whole system. Write it once inside the front cover, in the same handwriting every time, and the page becomes readable at a glance months later. Symbols also survive being scribbled in bad light at 11 p.m., which is when most of these entries get made.
One caution: keep the legend small and keep it fixed. A code that grows to nine or ten symbols defeats itself, because the user has to consult the key before every entry, and consulting a key is the moment the habit breaks.
Drawing the cycle as a strip, not a list
Lists of dates are hard to see as a shape. A strip of boxes drawn across the page, one box per day, turns a month into a picture, and pictures are what the eye is good at.
The method is simple. Draw a row of thirty or thirty-one small squares along a page edge, number them 1 to 31, and shade them according to the day. A new row starts each month, stacked below the last. After four months, four strips sit on the page, and the bleeding days line up or drift in a way that a column of dates never shows.
This is the method for anyone who has ever stared at a list of dates and felt nothing click. The drift is the information. A cycle that runs 29 days one month and 34 the next looks like a list of numbers; drawn as strips, it looks like a staircase, and the staircase is the thing worth noticing.
Pencil works better than pen here. Shading can be adjusted, and a strip drawn in error can be rubbed out without leaving a scar across the page.
A temperature row for anyone tracking ovulation
Basal body temperature adds a second dimension to the page, and it demands a specific kind of discipline: the same time each morning, before getting out of bed, with a thermometer that reads to a tenth of a degree. The reading goes into a row of numbers, one per day, and the row is plotted on a small graph beside the symbols.
The graph shows a subtle shift upward of a few tenths of a degree after ovulation, sustained until the next period. On paper, that shift is a step, and the step is the whole point of the exercise. It confirms ovulation after the fact rather than predicting it, which is a limitation worth stating plainly: temperature tracking tells a person what already happened, not what is about to.
Paper handles temperature well because the graph and the symbol log share a page. A thermometer app records numbers; the notebook records numbers next to a mood word and a pain score, and the interaction between them is where the useful reading lives.
What a year of pages actually shows
The real payoff of paper tracking arrives at the twelve-month mark, when a stack of filled pages can be spread out and compared. A pattern that is invisible day to day becomes obvious across a year: the headaches that cluster three days before bleeding, the low mood that lands on day 22 every month, the two cycles that ran long after a stretch of bad sleep.
This is where the paper system quietly outperforms most apps. An app shows a graph of the last three months and a prediction for the next. A notebook shows the actual record, in the actual handwriting, with the actual notes in the margin, and it does not summarize or smooth anything. The bad months stay visible. The anomalies stay where they were written.
The stack also travels. A person can carry a year of pages to an appointment and hand them over. Clinicians tend to read a handwritten log differently than a phone screen, and the notes in the margin often prompt the question that matters.
The three-day rule that keeps the habit alive
Paper tracking fails for one reason above all others: a missed day becomes a missed week, and a missed week becomes a blank page that feels like a failure. The fix is a rule, stated in advance, that a gap of up to three days gets filled in from memory, and anything longer gets a single line through the empty rows and a fresh start.
The crossed-out rows matter. They keep the page honest without turning it into a record of guilt. A notebook with a few struck-through weeks and eleven months of solid entries is a working system. A notebook abandoned in March because of one bad week is not.
Keep the whole kit in one place: the notebook, the pencil, the thermometer if there is one, all in the same drawer beside the bed. The system survives on being boring and reachable, and the drawer by the bed is the most reachable place in the house at the hour when entries get made.
Why the pencil beats the app for some people
There is a specific kind of relief in a tracking method that cannot notify, cannot sync, and cannot change its privacy policy. A paper chart sits in a drawer and asks for two minutes a day. It does not sell the pattern of a person's body to anyone, and it does not disappear when a company folds.
For someone who has tried three apps and abandoned all of them, the problem may not have been the tracking itself. It may have been the constant low hum of a phone that wanted attention for something else entirely. The paper page asks for one thing, at one time, and then goes quiet.
That quiet is the feature. A chart that lives in a drawer and gets filled in with a pencil is a small, private, durable record, and for a lot of people it is the first tracking method that ever lasted past the second month.